


MRCI would like to welcome Don Dawson as a new guest contributor! Don is an independent commodity futures trader with 35-plus years of experience. He has authored hundreds of articles on commodity markets and trading education and previously instructed futures classes for an international trading school for 15 years, where he received multiple awards. Learn more as a professional futures trader shows how he has used Moore Research for 15+ years!
Corn: Final Leg Up into its Seasonal High
Corn and other agricultural products tend to have consistent seasonal patterns. Due to weather patterns, crops are planted and harvested consistently. It results in predictable patterns of supply arriving at the market. Due to this consistency, traders should consider seasonal analysis when analyzing markets for trading opportunities.
The US is the world's largest corn producer. Corn trading on the Chicago Board of Trade (CBOT) was planted in the Spring. Crops harvested in a prior harvest season are called "the old crop." In contrast, corn harvested in the Fall is called "the new crop," which will bring new supply to the market.
The corn market has one new crop month, December, and multiple old crop months, March, May, July, and September. Commercial producers use the December contract as the primary hedging month of the new crop. Allowing them to get through the harvest season, which typically ends by early November, safely hedged. As the market approaches the Fall season, supply is still being drawn from old crop months (carry-over) and being depleted, resulting in higher prices to ration the crop until new supply arrives.
Moore Research Center, Inc. (MRCI) has found that corn has a consistent post-harvest rally into the Spring as the supply of corn is slowly depleted by exports, ethanol production, and livestock feed. At the same time, the supply of corn will not be replenished until the following Fall season.
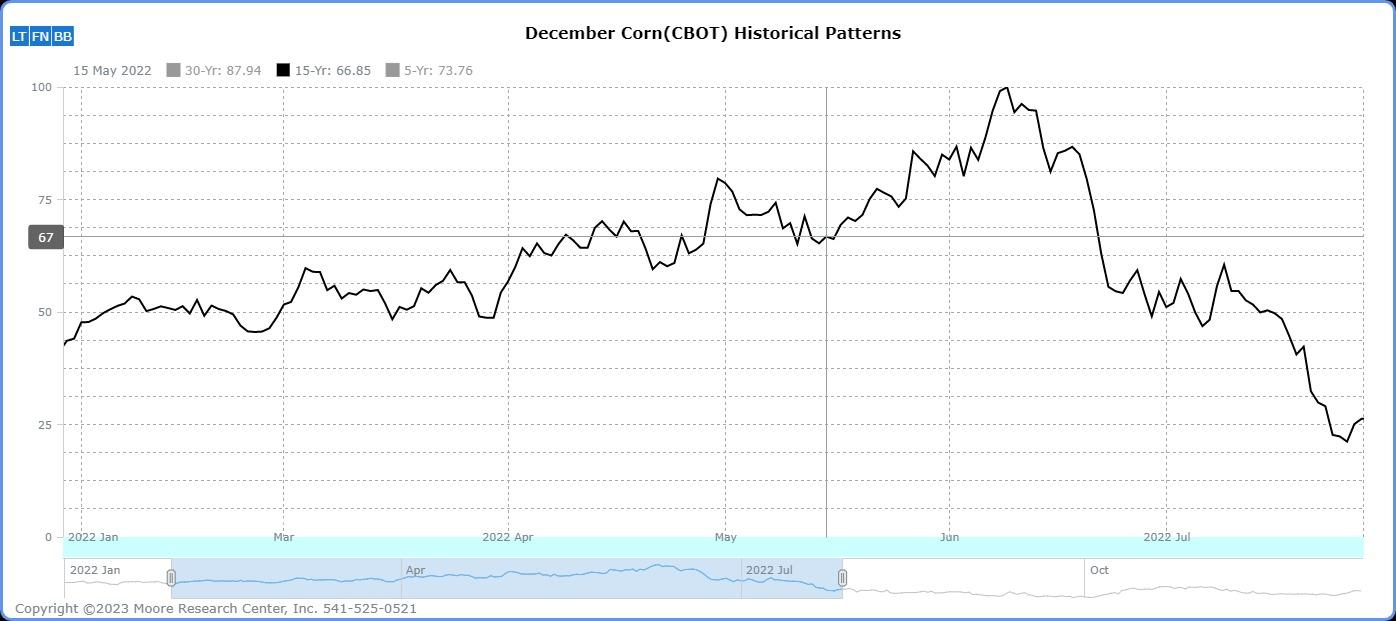
Source: Moore Research Center, Inc.
MRCI research illustrates how corn prices have a 15-year seasonal pattern of higher prices into the Spring. The more significant move begins near the end of March. Price rallies during April and May will allow producers to hedge their newly planted crops, as prices have historically peaked in June.
Using seasonal patterns is a form of a market screener for potential trade setups. Viewing the above chart is a form of a macro view of historical corn price patterns during the year.
MRCI also produces special reports for different market sectors to enhance the macro view with a micro view revealing specific action dates and historical simulated results.
MRCI's current Historical Grains Report reveals that 87% of the time in the past 15 years, corn prices have closed higher on May 01 than on March 29. The average profit was $1,329 per standard-size futures contract while in the trade for an average of 34 calendar days.
Now the stars are aligning. The macro view is signaling a resumption of the post-harvest rally as the corn supply continues to be depleted, and there is a concurrent micro view of a historical 87% win rate for this trade.
But, even with this significant information, traders must add additional analysis. Taking any seasonal pattern blindly is not recommended.
The Commitment of Traders (COT) Report
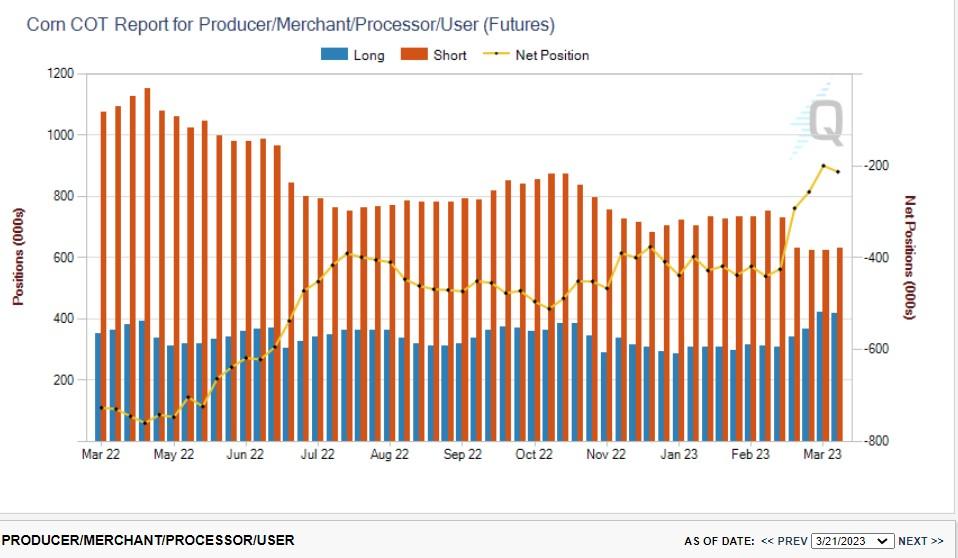
Source: CMEGroup
The dominant market participants in the corn market are the commercial traders, who hold the majority of open positions, sometimes as much as 60% of the overall corn market. Reviewing the recent COT report reveals that commercial traders are the least bearish on prices than at any time in the past 52 weeks (yellow.) Knowing this information after seeing a bullish MRCI seasonal corn pattern helps to strengthen this trade, but still no guarantees of it being successful.
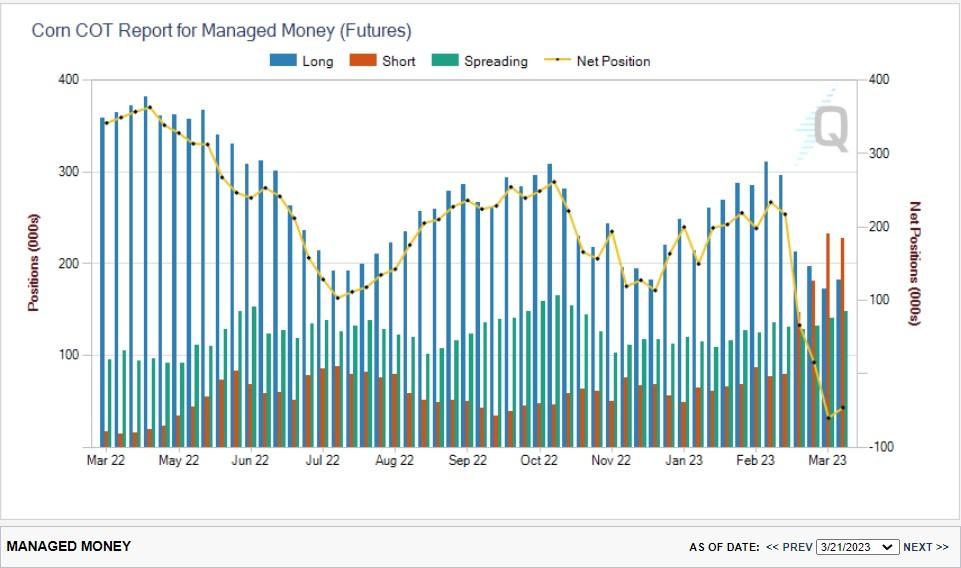
Source: CMEGroup
The second largest market participants in the corn market are managed money traders. Typically, their trading style is trend-following. Their trading size can push prices in long-term trends to allow the producers to sell at higher prices and the processors to buy at lower prices.
The COT report above illustrates that as of the last report, managed money was more bearish than any time during the past 52 weeks (yellow.)
Was the 12% drop in corn prices from January an exhaustion move on the part of managed money? If so, we could see managed money forced to cover their short positions by buying back contracts.
Summary
The corn market looks poised to resume its typical post-harvest rally. Seasonally the macro view indicates that corn could have a measurable rally from April into June, where the producers will be selling futures to hedge the new crop that was recently planted. Further information from the two COT reports indicates that the most vital participant, commercial traders, are bullish, and managed money is still short after a 12% decline might lead to a significant short-covering rally. With the additional micro view of a bullish trade setup basis MRCI's Historical Grains Report, we could see a market move worth our attention.
Moore Research Center, Inc. (MRCI), publishes seasonal research on futures markets on its web site www.mrci.com and in Special Historical Reports featuring specific market complexes. MRCI seasonal patterns are derived from daily closing prices, as are seasonal and spread trading strategies that have been reliable between specific dates in at least 80% of the last 15 years. MRCI has provided its research to the major futures exchanges and to both commercial and speculative traders. Learn more about MRCI's Special Historical Reports with this tutorial.
The above information is not intended to be a trade recommendation. Each trader is responsible for conducting due diligence to determine if the trade meets their risk tolerance before entering.
DISCLAIMER
SEASONAL TENDENCIES ARE A COMPOSITE OF SOME OF THE MORE CONSISTENT COMMODITY FUTURES SEASONALS THAT HAVE OCCURRED OVER THE PAST 15 YEARS. THERE ARE USUALLY UNDERLYING FUNDAMENTAL CIRCUMSTANCES THAT OCCUR ANNUALLY THAT TEND TO CAUSE THE FUTURES MARKETS TO REACT IN A SIMILAR DIRECTIONAL MANNER DURING A CERTAIN CALENDAR PERIOD OF THE YEAR. EVEN IF A SEASONAL TENDENCY OCCURS IN THE FUTURE, IT MAY NOT RESULT IN A PROFITABLE TRANSACTION AS FEES, AND THE TIMING OF THE ENTRY AND LIQUIDATION MAY IMPACT ON THE RESULTS. NO REPRESENTATION IS BEING MADE THAT ANY ACCOUNT HAS IN THE PAST OR WILL IN THE FUTURE ACHIEVE PROFITS UTILIZING THESE STRATEGIES. NO REPRESENTATION IS BEING MADE THAT PRICE PATTERNS WILL RECUR IN THE FUTURE. HYPOTHETICAL PERFORMANCE RESULTS HAVE MANY INHERENT LIMITATIONS, SOME OF WHICH ARE DESCRIBED BELOW. NO REPRESENTATION IS BEING MADE THAT ANY ACCOUNT WILL OR IS LIKELY TO ACHIEVE PROFITS OR LOSSES SIMILAR TO THOSE SHOWN. IN FACT, THERE ARE FREQUENTLY SHARP DIFFERENCES BETWEEN HYPOTHETICAL PERFORMANCE RESULTS AND THE ACTUAL RESULTS SUBSEQUENTLY ACHIEVED BY ANY PARTICULAR TRADING PROGRAM. ONE OF THE LIMITATIONS OF HYPOTHETICAL PERFORMANCE RESULTS IS THAT THEY ARE GENERALLY PREPARED WITH THE BENEFIT OF HINDSIGHT. IN ADDITION, HYPOTHETICAL TRADING DOES NOT INVOLVE FINANCIAL RISK, AND NO HYPOTHETICAL TRADING RECORD CAN COMPLETELY ACCOUNT FOR THE IMPACT OF FINANCIAL RISK IN ACTUAL TRADING. FOR EXAMPLE, THE ABILITY TO WITHSTAND LOSSES OR ADHERE TO A PARTICULAR TRADING PROGRAM IN SPITE OF TRADING LOSSES ARE MATERIAL POINTS WHICH CAN ALSO ADVERSELY AFFECT ACTUAL TRADING RESULTS. THERE ARE NUMEROUS OTHER FACTORS RELATED TO THE MARKETS IN GENERAL OR TO THE IMPLEMENTATION OF ANY SPECIFIC TRADING PROGRAM WHICH CANNOT BE FULLY ACCOUNTED FOR IN THE PREPARATION OF HYPOTHETICAL PERFORMANCE RESULTS AND ALL OF WHICH CAN ADVERSELY AFFECT ACTUAL TRADING RESULTS. RESULTS NOT ADJUSTED FOR COMMISSION AND SLIPPAGE.


