|
The following article was originally published in August 2001. Some minor
edits have been incorporated for readability, but all information is still
current as of that time.
In a world in which account size and margin are irrelevant and counter-seasonality
does not exist, trading a seasonal methodology is a no-brainer. You simply enter
and exit seasonal strategies on the appropriate days for each trade. In other
words, your account is large enough to take every strategy without worrying
about whether you have enough margin or whether this will be the year in which a
particular strategy decides to head south. Unfortunately, few people have both
the resources and the desire to take every single seasonal strategy and also to
sit through any and all drawdowns.
Moore Research Center, Inc. (MRCI) has found that our own previously
published seasonal strategies would have generated optimal results by trading
each and every strategy and without using stops. In real time, however, traders
must be practical, for most have limited or, at least, finite resources and do
not inhabit the hypothetical world of unlimited funds. Thus, drawdowns and
allocation of resources are vitally important components of trading. We intend
to introduce several ways to evaluate seasonal strategies to optimize selections
before even considering technical or fundamental analysis, instead addressing
margin, historical return, consistency, and volatility.
Performance Bond (Margin)
No analysis of return would be complete without discussing margin (performance
bond) and its restrictions on diversifying a portfolio. An example of where
this could be extremely important would be in trading S&P 500 futures. The
current exchange minimum margin(on June 11, 2001) for the full-sized S&P 500 was
$21,563 initial/ $17,250 maintenance. However, the initial margin for the E-mini
was only $4,313, while maintenance is $3,450. Many traders would better utilize
their funds by trading E-mini contracts instead of the full-sized version,
saving funds to diversify into other markets with other strategies.
Historical Return
The basis for our analysis of historical return is a December British Pound
seasonal strategy:
Pos |
Market |
Mth |
Entry |
Exit |
Win
Pct |
Win |
Lose |
Total |
Avg
Profit |
Avg/
Day |
| Buy |
British Pound(IMM) |
Dec |
8/17 |
10/14 |
80 |
12 |
3 |
15 |
1471 |
25.37 |
Incorporating margin into a basic analysis of rate-of-return results in the
following formula for the above British Pound strategy:
Historical Average Profit
Initial Margin |
times |
Days In Year
Days In Trade |
times 100% equals |
Return on
Investment |
This computation takes into account the relationship between the strategy's
historical profit, current margin, and length of exposure. To illustrate the
point, if we compare an S&P 500 strategy with the same historical average profit
but with an initial margin of $21,563, the value would be approximately 41%.
Stated another way, historical average profits of $22,331 would be required to
get the same rate of return on margin required. Thus, the former appears to
be a much more palatable, realistic, and profitable strategy.
| British Pound = |
1471
1418 |
x |
365
60 |
x 100 = 631% |
| S&P 500 = |
1471
22563 |
x |
365
60 |
x 100 = 41% |
Consistency
To evaluate consistency, let's examine the December British Pound strategy
detail.
| British Pound(IMM)-December |
| Buy on approximately 08/17 - Exit on approximately 10/14 |
Contract Size: 62,500 British Pounds |
Cont
Year |
Buy
Date |
Buy
Price |
Exit
Date |
Exit
Price |
Profit |
Profit
Amount |
Best
Equity
Date |
Best
Equity
Amount |
Worst
Equity
Date |
Worst
Equity
Amount |
| 2000 |
08/17/00 |
150.26 |
10/13/00 |
145.36 |
-4.90 |
-3062.50 |
|
|
09/15/00 |
-6337.50 |
| 1999 |
08/17/99 |
160.58 |
10/14/99 |
166.46 |
5.88 |
3675.00 |
10/14/99 |
3675.00 |
08/25/99 |
-1175.00 |
| 1998 |
08/17/98 |
160.56 |
10/14/98 |
169.96 |
9.40 |
5875.00 |
10/08/98 |
6225.00 |
|
|
| 1997 |
08/18/97 |
160.38 |
10/14/97 |
161.68 |
1.30 |
812.50 |
09/25/97 |
1187.50 |
09/04/97 |
-1712.50 |
| 1996 |
08/19/96 |
154.34 |
10/14/96 |
157.98 |
3.64 |
2275.00 |
10/14/96 |
2275.00 |
|
|
| 1995 |
08/17/95 |
154.48 |
10/13/95 |
157.14 |
2.66 |
1662.50 |
09/21/95 |
3112.50 |
08/22/95 |
-950.00 |
| 1994 |
08/17/94 |
153.90 |
10/14/94 |
159.30 |
5.40 |
3375.00 |
10/14/94 |
3375.00 |
08/26/94 |
-650.00 |
| 1993 |
08/17/93 |
147.64 |
10/14/93 |
150.90 |
3.26 |
2037.50 |
09/10/93 |
4112.50 |
08/25/93 |
-375.00 |
| 1992 |
08/17/92 |
188.34 |
10/14/92 |
169.08 |
-19.26 |
-12037.50 |
09/08/92 |
5337.50 |
10/08/92 |
-13775.00 |
| 1991 |
08/19/91 |
159.92 |
10/14/91 |
169.84 |
9.92 |
6200.00 |
10/03/91 |
8475.00 |
|
|
| 1990 |
08/17/90 |
188.36 |
10/12/90 |
194.94 |
6.58 |
4112.50 |
10/11/90 |
4837.50 |
09/21/90 |
-4225.00 |
| 1989 |
08/17/89 |
153.64 |
10/13/89 |
155.14 |
1.50 |
937.50 |
09/26/89 |
4187.50 |
09/05/89 |
-1287.50 |
| 1988 |
08/17/88 |
167.66 |
10/14/88 |
174.84 |
7.18 |
4487.50 |
10/14/88 |
4487.50 |
09/01/88 |
-1687.50 |
| 1987 |
08/17/87 |
157.90 |
10/14/87 |
165.35 |
7.45 |
4656.25 |
10/14/87 |
4656.25 |
|
|
| 1986 |
08/18/86 |
147.20 |
10/14/86 |
142.50 |
-4.70 |
-2937.50 |
08/20/86 |
937.50 |
10/08/86 |
-3843.75 |
| Percentage Correct |
80 |
|
|
|
| Average Profit on Winning Trades |
5.35 |
3342.19 |
|
Winners |
12 |
| Average Loss on Trades |
-9.62 |
-6012.50 |
|
Losers |
3 |
| Average Net Profit Per Trade |
2.35 |
1471.25 |
|
Total trades |
15 |
SEASONAL TENDENCIES ARE A COMPOSITE OF SOME OF THE MORE CONSISTENT COMMODITY FUTURES SEASONALS THAT
HAVE OCCURRED OVER THE PAST 15 YEARS. THERE ARE USUALLY UNDERLYING FUNDAMENTAL CIRCUMSTANCES THAT
OCCUR ANNUALLY THAT TEND TO CAUSE THE FUTURES MARKETS TO REACT IN A SIMILAR DIRECTIONAL MANNER
DURING A CERTAIN CALENDAR PERIOD OF THE YEAR. EVEN IF A SEASONAL TENDENCY OCCURS IN THE FUTURE, IT
MAY NOT RESULT IN A PROFITABLE TRANSACTION AS FEES, AND THE TIMING OF THE ENTRY AND LIQUIDATION MAY
IMPACT ON THE RESULTS. NO REPRESENTATION IS BEING MADE THAT ANY ACCOUNT HAS IN THE PAST OR WILL IN
THE FUTURE ACHIEVE PROFITS UTILIZING THESE STRATEGIES. NO REPRESENTATION IS BEING MADE THAT
PRICE PATTERNS WILL RECUR IN THE FUTURE.
HYPOTHETICAL PERFORMANCE RESULTS HAVE MANY INHERENT LIMITATIONS,
SOME OF WHICH ARE DESCRIBED BELOW. NO REPRESENTATION IS BEING MADE
THAT ANY ACCOUNT WILL OR IS LIKELY TO ACHIEVE PROFITS OR LOSSES SIMILAR
TO THOSE SHOWN. IN FACT, THERE ARE FREQUENTLY SHARP DIFFERENCES BETWEEN
HYPOTHETICAL PERFORMANCE RESULTS AND THE ACTUAL RESULTS SUBSEQUENTLY
ACHIEVED BY ANY PARTICULAR TRADING PROGRAM. ONE OF THE LIMITATIONS
OF HYPOTHETICAL PERFORMANCE RESULTS IS THAT THEY ARE GENERALLY
PREPARED WITH THE BENEFIT OF HINDSIGHT. IN ADDITION, HYPOTHETICAL
TRADING DOES NOT INVOLVE FINANCIAL RISK, AND NO HYPOTHETICAL TRADING RECORD
CAN COMPLETELY ACCOUNT FOR THE IMPACT OF FINANCIAL RISK IN ACTUAL TRADING.
FOR EXAMPLE, THE ABILITY TO WITHSTAND LOSSES OR ADHERE TO A PARTICULAR TRADING
PROGRAM IN SPITE OF TRADING LOSSES ARE MATERIAL POINTS WHICH CAN ALSO ADVERSELY
AFFECT ACTUAL TRADING RESULTS. THERE ARE NUMEROUS OTHER FACTORS RELATED TO THE
MARKETS IN GENERAL OR TO THE IMPLEMENTATION OF ANY SPECIFIC TRADING PROGRAM WHICH
CANNOT BE FULLY ACCOUNTED FOR IN THE PREPARATION OF HYPOTHETICAL PERFORMANCE RESULTS
AND ALL OF WHICH CAN ADVERSELY AFFECT ACTUAL TRADING RESULTS. RESULTS NOT ADJUSTED
FOR COMMISSION AND SLIPPAGE.
|
Upon evaluating the Best Equity Amount and Profit Amount columns, we
see that 12 of the 15 years saw an open equity greater than the historical
average profit and 10 of them closed out with equity greater than the average.
This trade has been extremely consistent. This type of consistency would seem
much more reliable than one which saw an open equity greater than the historical
average in, for example, only 7 out of 15 years and which closed greater in only
5.
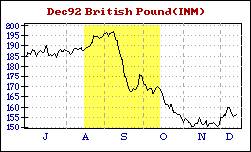 Interestingly enough, in this example two of the three years, which did not see
at least the historical average, resulted in losing trades. One (2000) never
had a closing profit at all, while the other (1986) peaked three days into the
trade and then failed. Looking at a chart, we see that the market did make one
attempt to rally but failed before selling off dramatically. The third year (1992)
deserves separate mention. This particular year saw significant early open
equity but then lost dramatically. We mention this separately because this was
the result of a one-time governmental intervention which directly devalued the
pound and which could not have been foreseen by historical research. Do your
homework! When you find catastrophic results like this, try to find out what
happened and why and then evaluate the probabilities of something similar
happening again. Attempt to analyze around the results. Do not forget about
them, as they are a potent reminder of how risky trading really is, but attempt
to exclude such extremes when evaluating practical stops.
Interestingly enough, in this example two of the three years, which did not see
at least the historical average, resulted in losing trades. One (2000) never
had a closing profit at all, while the other (1986) peaked three days into the
trade and then failed. Looking at a chart, we see that the market did make one
attempt to rally but failed before selling off dramatically. The third year (1992)
deserves separate mention. This particular year saw significant early open
equity but then lost dramatically. We mention this separately because this was
the result of a one-time governmental intervention which directly devalued the
pound and which could not have been foreseen by historical research. Do your
homework! When you find catastrophic results like this, try to find out what
happened and why and then evaluate the probabilities of something similar
happening again. Attempt to analyze around the results. Do not forget about
them, as they are a potent reminder of how risky trading really is, but attempt
to exclude such extremes when evaluating practical stops.
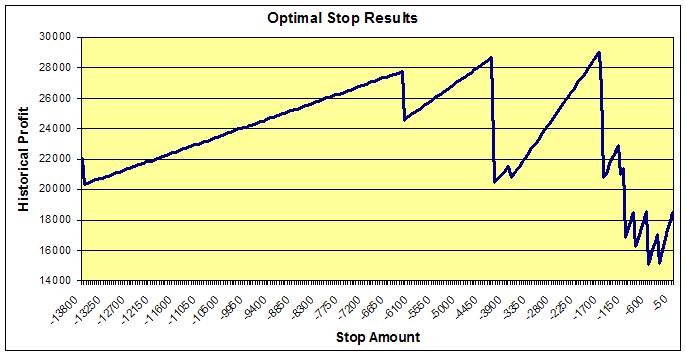
Volatility
When discussing volatility in this particular instance, we're really talking
about comfort. Is this trade so wildly volatile that enormous drawdowns must be
suffered in the hope of ending with profits? Or can one sleep nights, enduring
an acceptable level of volatility (acceptable being relative for each individual,
of course). In this particular case, we attempted to optimize a protective stop
by evaluating every possible value from of $50 to $13,800 (1992's worst drawdown,
rounded up) in $50 increments. This stop optimization, shown in the
accompanying graph, resulted in an optimal stop of $1,750. (Note the dramatic
saw-tooth transitions as each year's worst drawdown is picked up and historical
profit increases until the next, with the peak amount showing up between the
drawdowns for winning and losing years.) Using $1,750 as a stop, this trade
would have succeeded in 11 of 15 years and raised the average annual return to
$1,933. So, by simply analyzing drawdown, one could have increased the average
annual return by over 30% with a only minor drop in winning trade percentage. In
addition, one could have predetermined his dollar-risk to only 19% more than
the theoretical return.
There are other methodologies for establishing personally acceptable risk. The
primary concept is that it simply needs to be accomplished. One may not always
be able to improve return while reducing risk, but the idea is to sleep better
and play the game longer.
Conclusion
Finally, every seasonal trade is not for every trader. Account size limits
ability to absorb risk as well as to diversify and to maintain multiple
positions. Personal temperament determines one's emotional ability to accept
risk, to weather drawdowns, and to "stay with the program." The amount of time
available to monitor and evaluate markets also drives how selective a trader can
and must be.
The purpose of this discussion has been to help traders with finite resources to
evaluate and better select from among potential seasonal strategies to trade in
real-time without, or at least before, analyzing current technical or
fundamental conditions. Even the best analysts cannot see into the futures and
predict what the market will do. Thus, taking the time well in advance to
objectively evaluate the relative merits based on current margin requirements,
rate of historical return, consistency of gain, and volatility of a group of
seasonal strategies can make the difference between sleeping well, surviving,
and prospering versus becoming only a spectator.
| *There is a risk of loss in futures trading. |
|