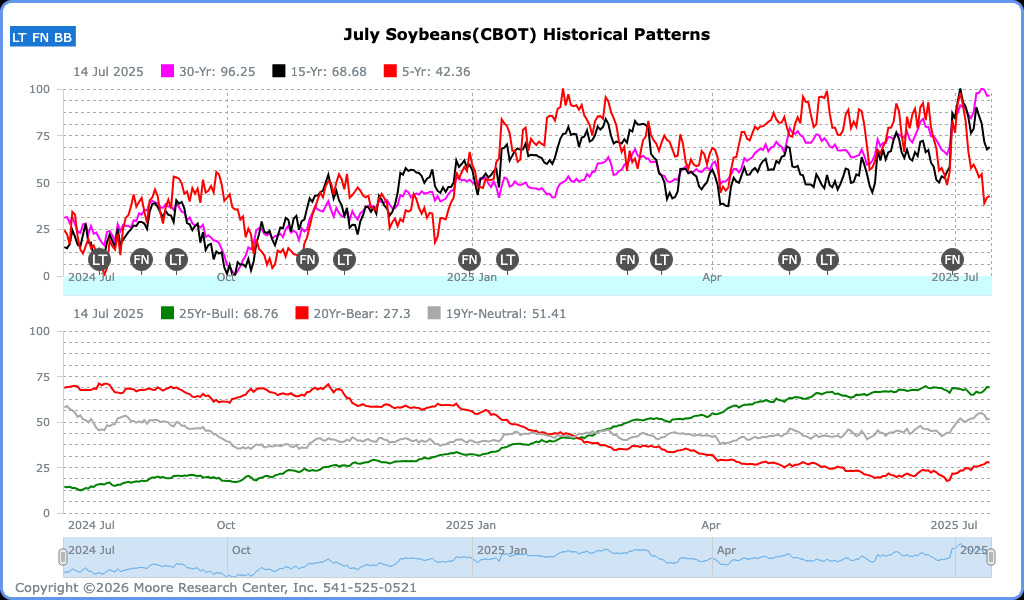
How do you define a bullish and bearish year ?
(1) For each past year, a regression analysis is run for the closing prices and a trendline drawn that best describes them.
If the slope of that trendline is +30 degrees or greater, it is considered a bull year; if that slope is more negative than -30 degrees,
it is considered a bear year.
(2) To create a composite, we first take the price for each day in a given year and scale it from 0 to 100. For example, if the lowest
price for the year was 15 and the highest was 35, we would assign the day when it traded 15 a value of 0 and the day when it traded
35 a value of 100 ---- and then scale all other prices proportionally. After doing that for each of the years included in the study, we
average the data points for each day.
The end result produces charts like the example below.
MRCI ONLINE subscribers can view our bull/bear charts in the following sections: